Tag: Year 2020*
-
Mask Mandates: A History of Rebellion

ElyaDatabase ID Number: M164 Creator: Cameron Issacs ’21 Public Health The influenza pandemic of 1918 was the most-deadly flu outbreak in history; it was caused by an H1N1 virus of avian origin. The virus spread worldwide during 1918-1919 and as seen on the map, it was first identified in the United States in April of 1918…
-
AIDS Infection Rates vs. Gay owned Business Shutdowns, and COVID-19 Positive Cases vs. Asian American Owned Business Shutdown Hotspots

ElyaDatabase ID Number: M177 Creator: Kayla Ballas ’24 Public Health The first map displays the infection rates of AIDS per 100,000 people in juxtaposition to areas with high business closure rates. The lightest shade of red represents less than 10 cases per 100,000 people, the next shade of red represents 10-19.9 cases per 100,000 people, the…
-
SARS in China 2003
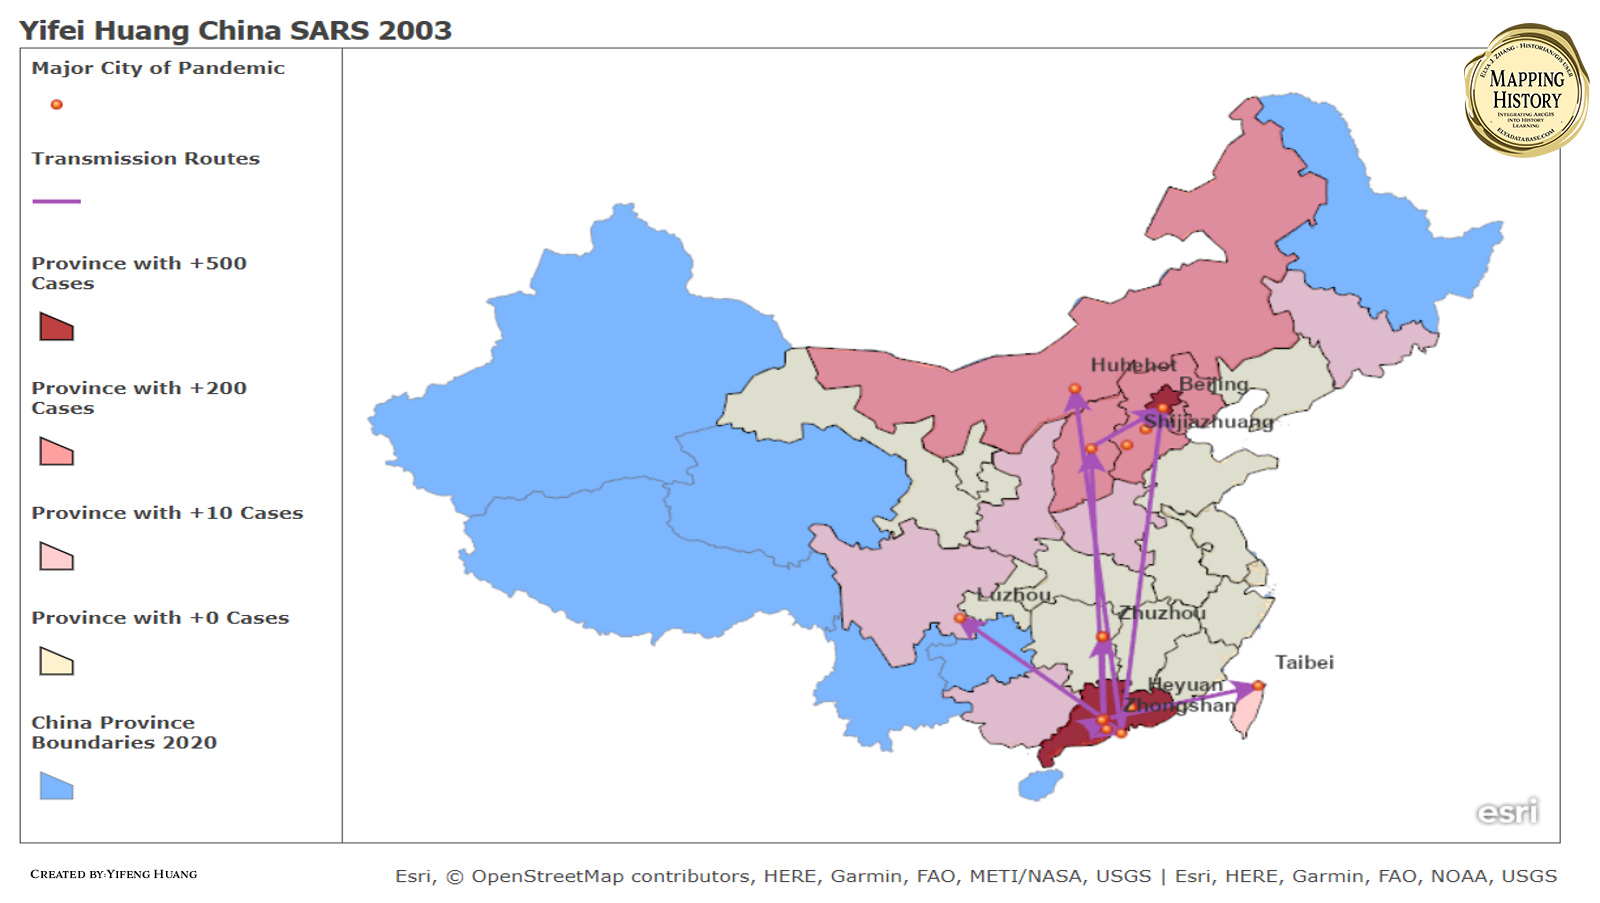
ElyaDatabase ID Number: M176 Creator: Yifeng Huang ’22 Optics These are the maps that show the total infected and the transmission routes of the SARS in China in the year of 2003 till May. The major cities of SARS pandemic were mainly concentrated in Guangdong province and then spread to the whole country. The graph on…
-
Migratory Patterns of TB (1880’s), and COVID-19 (2019)

ElyaDatabase ID Number: M175 Creator: Tara Sola ’21 Applied Music This map shows the comparison between large-scale migration trends during two worldwide pandemics. The first pandemic is the Tuberculosis pandemic of the 1880’s, which lasted approximately from 1882-1954. This pandemic caused mass migration from cities to less-populated areas. The overall trajectory of those that moved due…
-
Mask Mandates during the Spanish Flu and COVID-19

ElyaDatabase ID Number: M174 Creator: Nicole Babkowski ’22 Public Health The COVID-19 outbreak in March 2020 was the first infectious disease to test the nation’s public health response since the influenza virus outbreak of 1918. The influenza virus–also known as the Spanish Flu–hit the United States in three consecutive waves; the second wave was extremely detrimental…
-
The distribution and spread of COVID-19 and SARS cases

ElyaDatabase ID Number: M173 Creator: Yuqing Zhai ’22 Digital Media Studies This map shows a comparison between the distribution and spread of COVID19 and SARS cases, supplementing with a focused map of Asia (sharing the same legend). We can see both viruses were started in China: Guangdong and Hubei. The points on the map are regions…
-
An Analysis of the 1918 Spanish Flu, the 2020 COVID-19 Pandemic, and the Lasting Effects of Racial Disparities in the African Diaspora Exposed Through These Pandemics

ElyaDatabase ID Number: M172 Creator: Christina Inya ’21 Public Health This map demonstrates one of the commonalities between the 2020 COVID-19 pandemic and the 1918 Spanish Flu, in how the infection rates disproportionately targeted the Black communities living in America. It is especially interesting to note how during the 1918 Spanish flu, the top six most…
-
The Coronavirus Outbreak Before March 11th 2020

ElyaDatabase ID Number: M170 Creator: Jiaoyang Li ’22 Digital Media Studies This map mainly illustrates the outbreak of the Coronavirus before 11 March 2020. It represents how rapid covid-19 spreads to nearly every continent on the Earth and it only stands for the time before 11 march this year. I spent almost one and a half…
-
AIDS and COVID-19 Social Uprisings and Protests

ElyaDatabase ID Number: M169 Creator: Debie Aguilar ’22 Public Health This map details the AIDS and COVID-19 pandemic social uprisings that occurred throughout the United States. The blue squares show the cities that were affected by large number of COVID-19 cases and the purple squares depict the cities affected by AIDS cases. To further show the…
-
AIDS Response US vs. Canada (The First 5 Years)

ElyaDatabase ID Number: M171 Creator: Josh Allon ’21 History The points illustrated represent various events that occurred in each country in approximately the first five years after each nation discovered their first cases of AIDS (not necessarily meaning they knew they were cases of AIDS at the time). The types of events represented by these points…