Tag: Year 2020*
-
The Correlation Between State Pandemic Responses and States with Non-Discrimination Laws
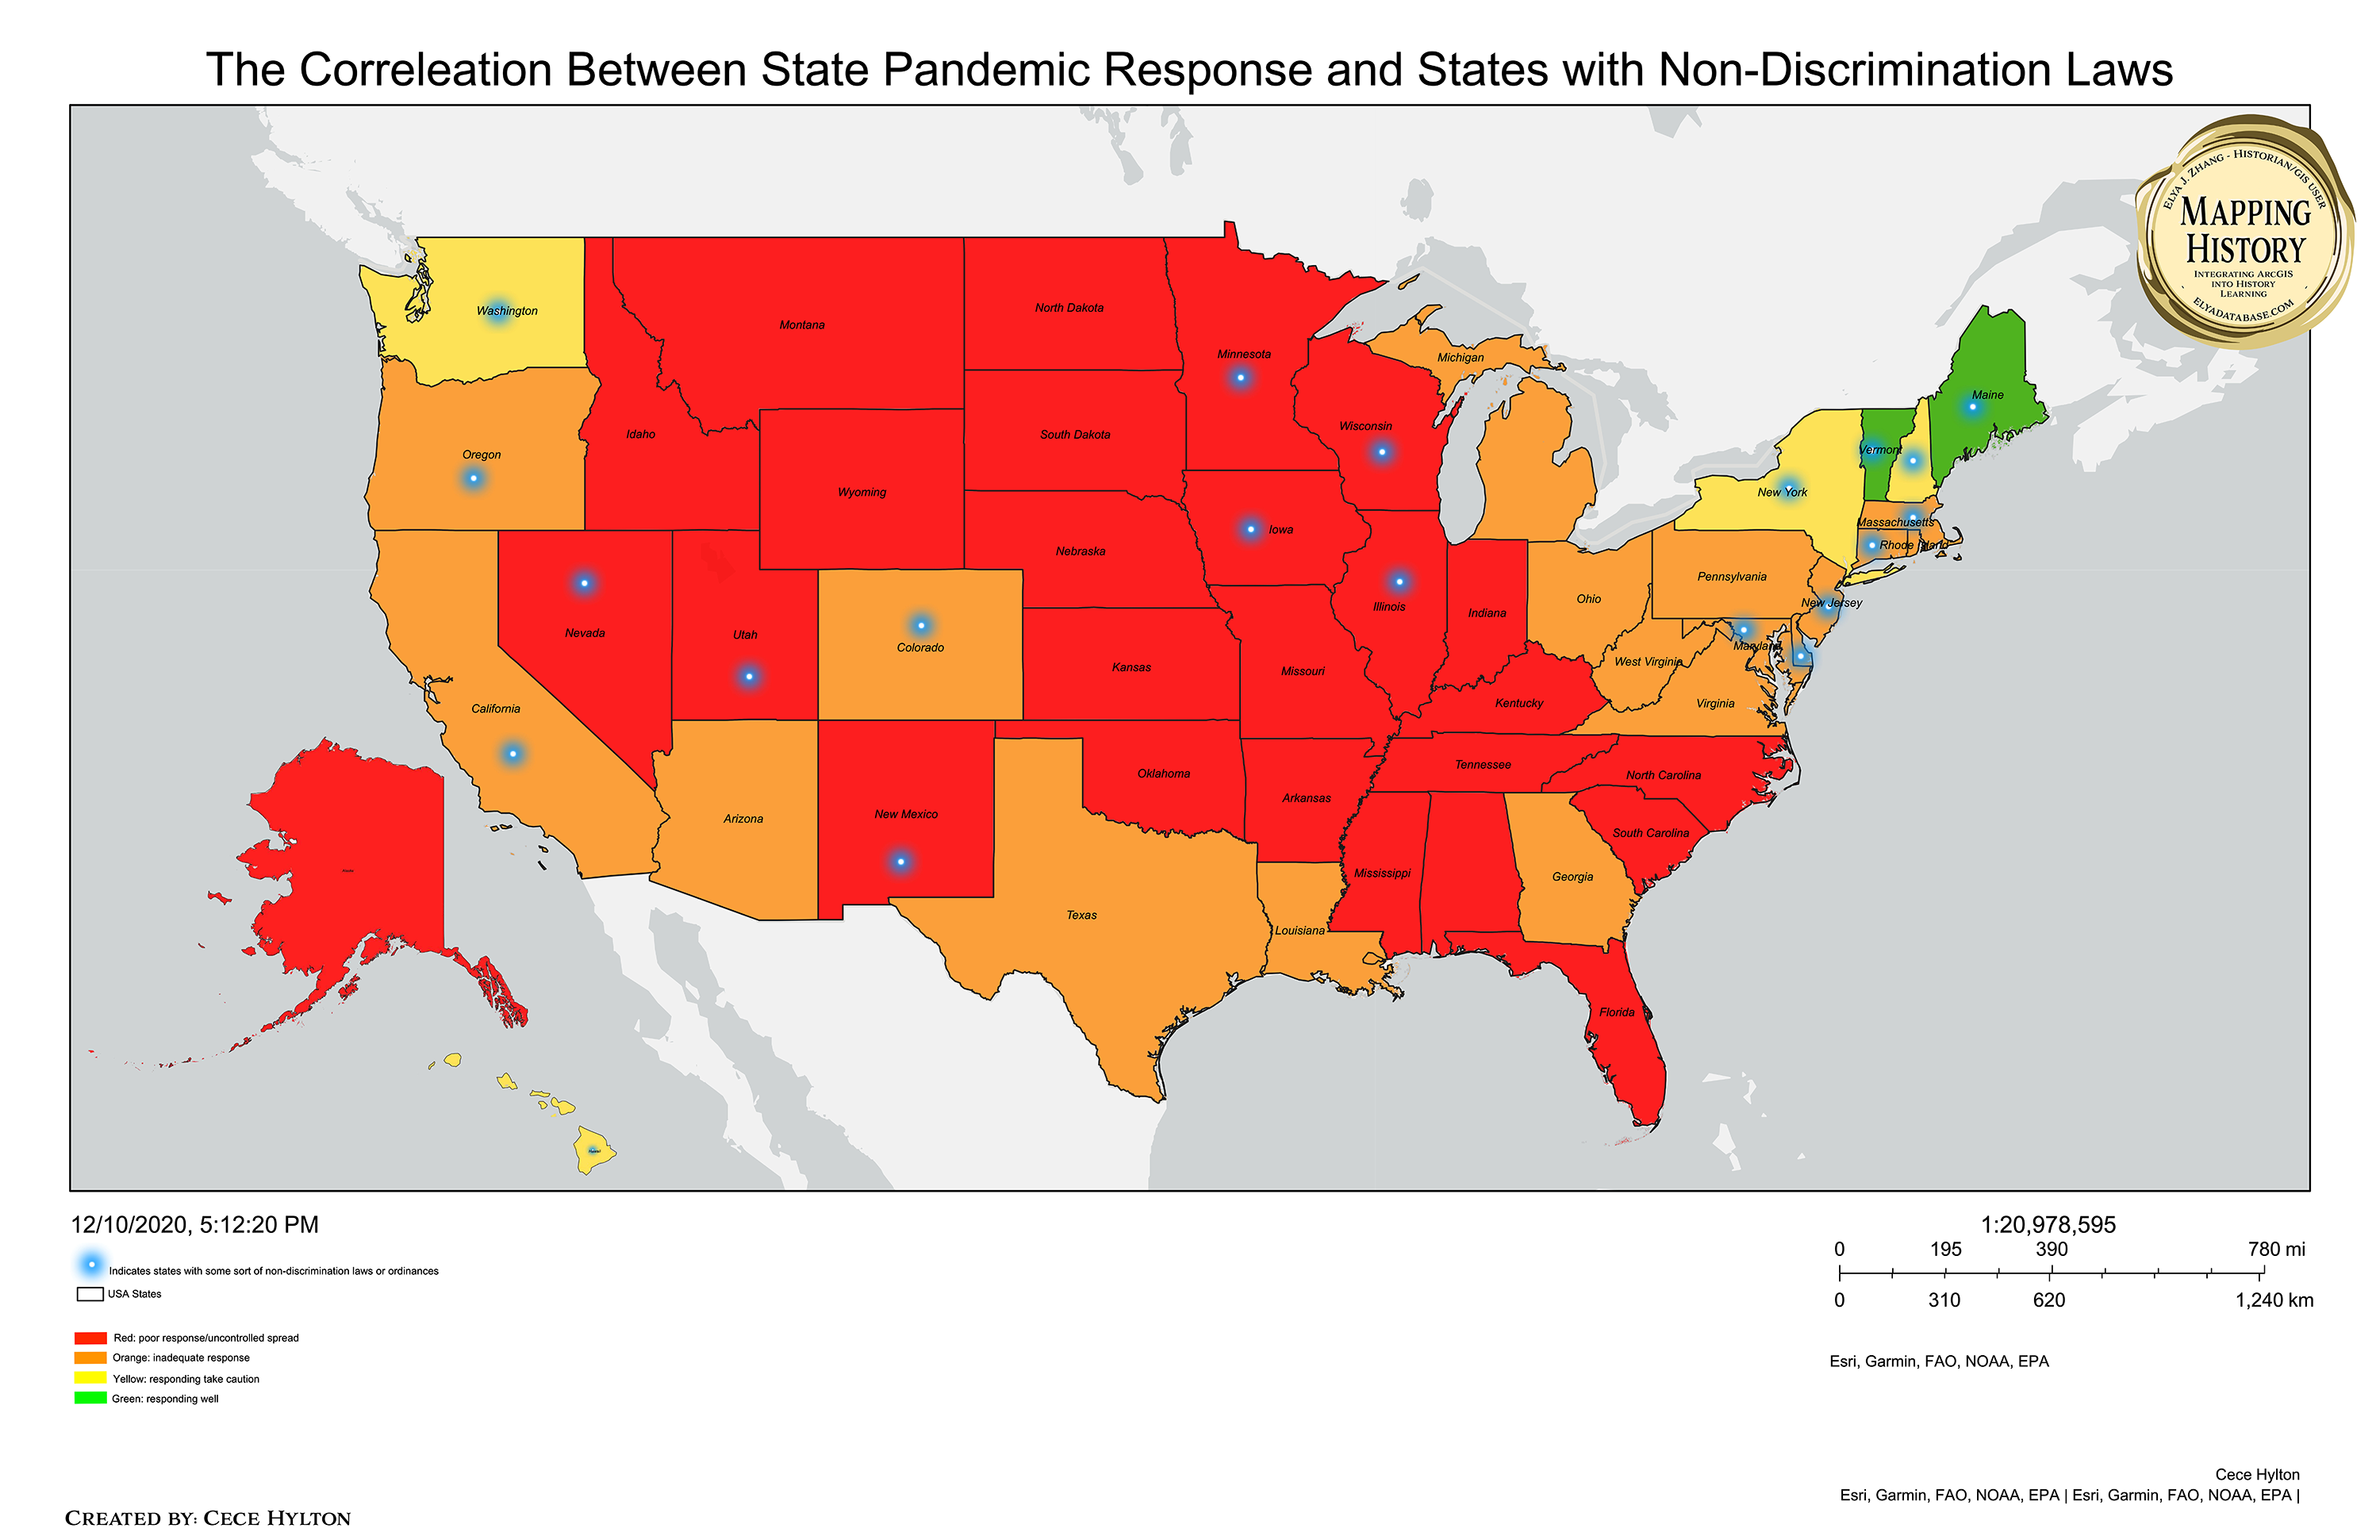
ElyaDatabase ID Number: M168 Creator: Cece Hylton ’22 Neuroscience This map draws a correlation between discrimination and pandemic response, specifically in the United States of America during Covid-19. Each state is shaded either red, orange, yellow, or green. Red indicates states that are responding very poorly, and there is uncontrolled spread. Orange indicates states with an…
-
Rise in Hate Crime Reports From 2019 to 2020

ElyaDatabase ID Number: M167 Creator: Ian Ono-Gerow ’21 East Asian Studies The Map shows the increase in the number of reported cases of hate crime in some of the major cities in the United States, comparing the year 2019 which was before the Covid-19 pandemic, and the year 2020, which is after the pandemic has started.…
-
California’s Deaths from the Pandemic
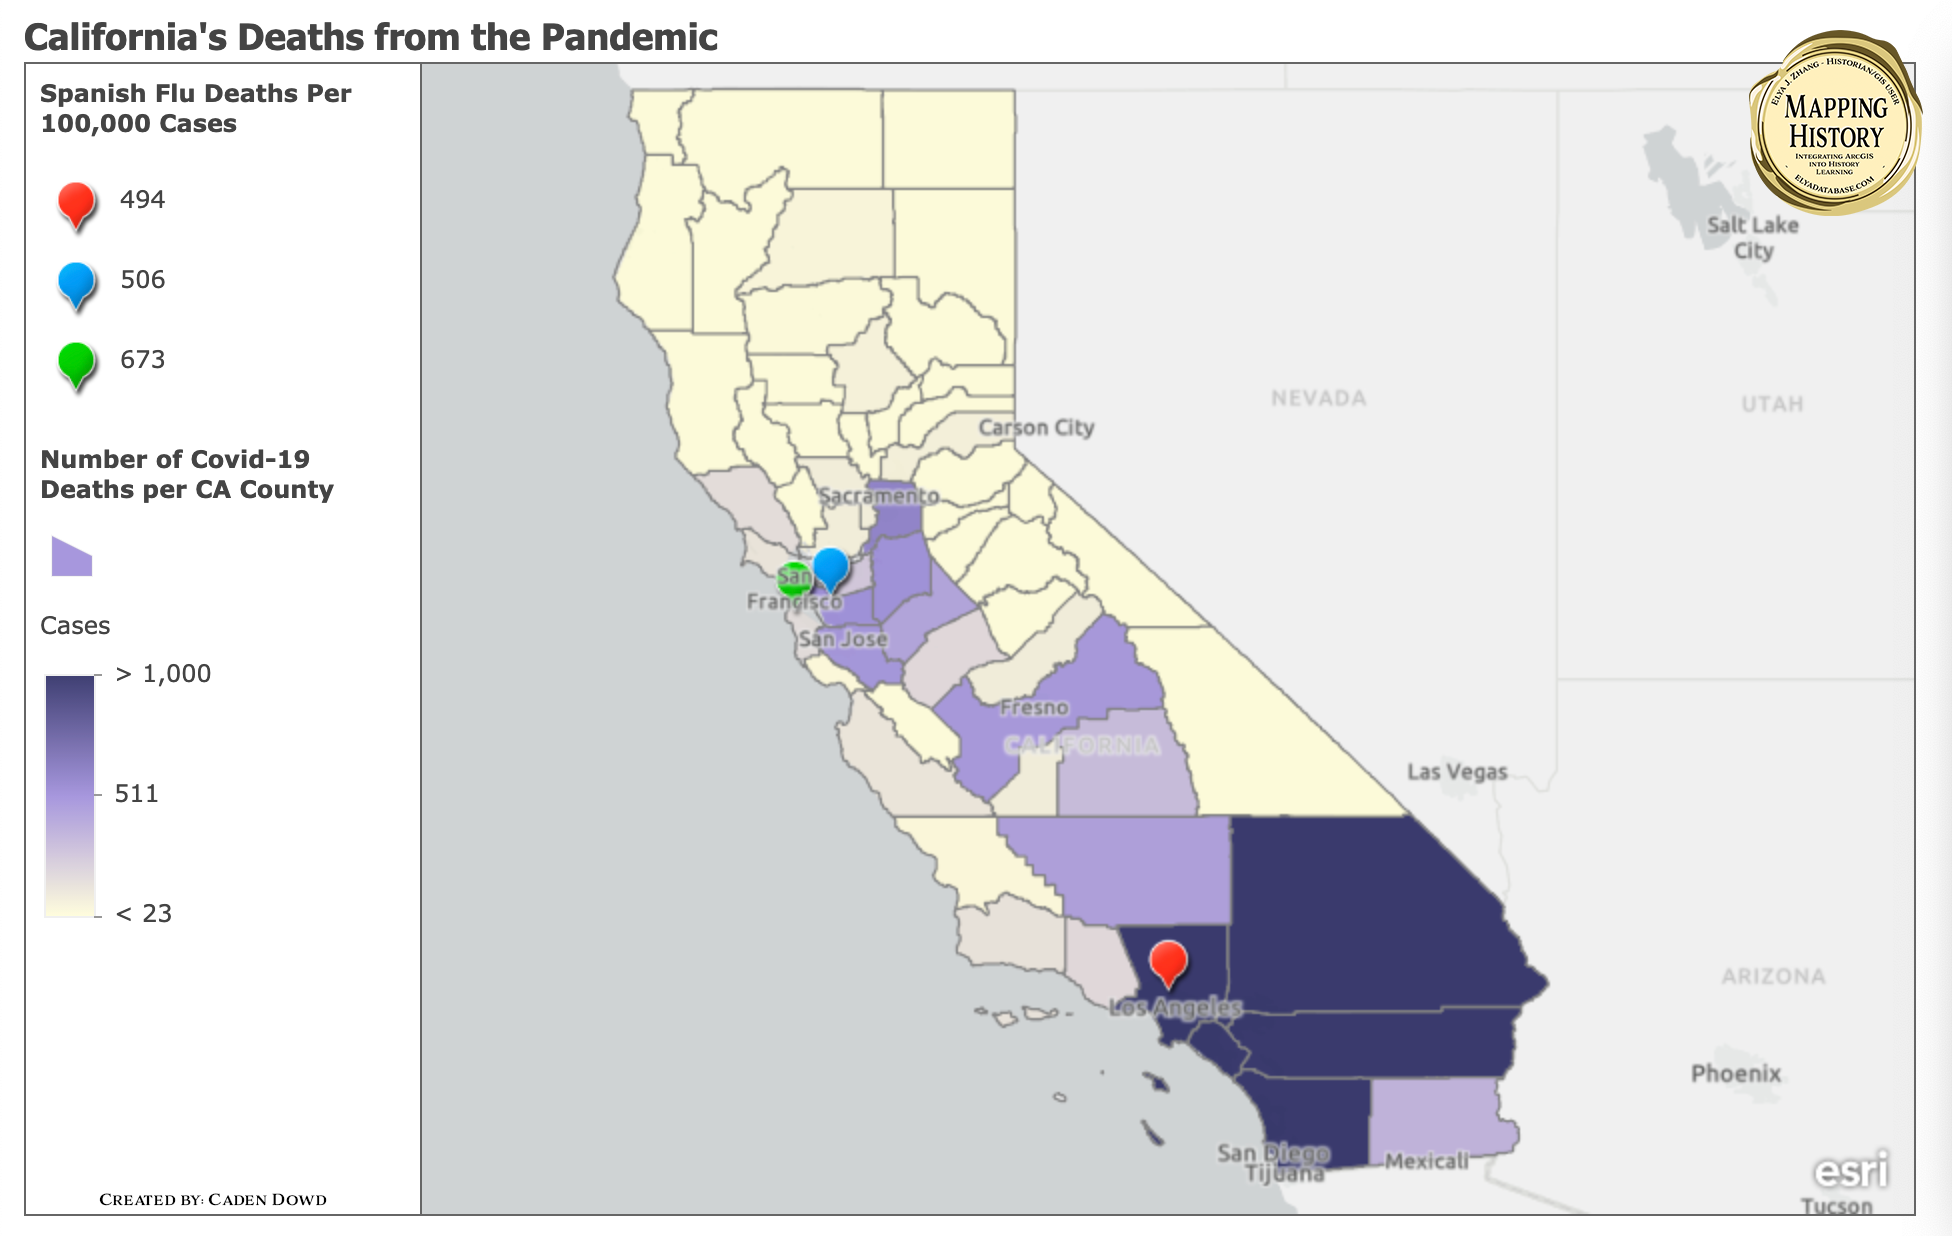
ElyaDatabase ID Number: M165 Creator: Caden Dowd ’22 Computer Science The map attempts to show both the Spanish flu and Covid-19’s effects in California during the pandemic. There was only data from the Spanish flu on death rates so that is what this map focuses on. There are individual points in the major cities that illustrate…
-
Mandatory School Closings for the Rest of the 2019-2020 School Year by US State During COVID-19 (Days after Pandemic Declaration on 3/11/20)

ElyaDatabase ID Number: M114 Creator: Marjorie Rowe ’21 Microbiology The COVID-19 pandemic impacted and continues to impact many parts of normal life. This map describes the early panic and shutdown of public schools in the United States. This map considers the start of the pandemic to be March 11, 2020, the day that it was…
-
AIDS and COVID-19 on the Campaign Trail: Reagan and Biden

ElyaDatabase ID Number: M113 Creator: Daniel Breault ’23 Optical Engineering Reagan, Trump, and Biden’s presidencies have often been judged mainly by the actions they took (or did not take) with regards to AIDS and COVID-19. But each candidates’ attitudes first emerged on the campaign trail. Shown here is a map with CDC data overlaying a…
-
COVID-19 and Lack of Health Insurance in the U.S.

ElyaDatabase ID Number: M110 Creator: Angie Cortez ’24 Political Science & Japanese This map depicts the number of COVID cases per 100,000 in the United States since January 2020 to April 17, 2021 and the percentage of people who lack health insurance in each state in 2019. The data shows that although there is variability…
-
Effect of Chinese Government Responses on COVID-19

ElyaDatabase ID Number: M109 Creator: Ruoyu Wang ’22 Digital Media Studies & Studio Art This big map that consists of six small maps provides a clear and direct view of showing how COVID-19 started to conquer China at the beginning of 2020. For the purpose of direct comparison, colors of different levels of confirmed cases…
-
BLM Demonstrations Relationship to Covid Cases during June 2020

ElyaDatabase ID Number: M107 Creator: Gilian Mair ’22 Biomedical Engineering In this map, the relationship between the frequency and size of BLM protests in large cities is shown alongside the rise or fall in the rate of Covid cases during June. This month was chosen because it followed the death of George Floyd on May…
-
Mask Wearing Mandates: 1918 versus 2020

ElyaDatabase ID Number: M106 Creator: Maddy Davidson ’22 Health, Behavior & Society and Economics The 1918 flu was a deadly strain of the influenza strain that swept the country in the early 20th century. States and cities most commonly responded to this crisis by having laws against public spitting, and gatherings, and a few states…
-
Racial Disparities in COVID-19

ElyaDatabase ID Number: M105 Creator: Diana Rodriquez ’22 Public Health With the outbreak of Covid-19, immediate hot zones began to appear that correlated with lower socio-economic status, attuned to minority populations. It fueled anger and shock; however this is not the first time nor will it be the last that diseases continue to ravage such…