Tag: United States*
-
Mask Mandates: A History of Rebellion

ElyaDatabase ID Number: M164 Creator: Cameron Issacs ’21 Public Health The influenza pandemic of 1918 was the most-deadly flu outbreak in history; it was caused by an H1N1 virus of avian origin. The virus spread worldwide during 1918-1919 and as seen on the map, it was first identified in the United States in April of 1918…
-
The distribution and spread of COVID-19 and SARS cases

ElyaDatabase ID Number: M173 Creator: Yuqing Zhai ’22 Digital Media Studies This map shows a comparison between the distribution and spread of COVID19 and SARS cases, supplementing with a focused map of Asia (sharing the same legend). We can see both viruses were started in China: Guangdong and Hubei. The points on the map are regions…
-
An Analysis of the 1918 Spanish Flu, the 2020 COVID-19 Pandemic, and the Lasting Effects of Racial Disparities in the African Diaspora Exposed Through These Pandemics

ElyaDatabase ID Number: M172 Creator: Christina Inya ’21 Public Health This map demonstrates one of the commonalities between the 2020 COVID-19 pandemic and the 1918 Spanish Flu, in how the infection rates disproportionately targeted the Black communities living in America. It is especially interesting to note how during the 1918 Spanish flu, the top six most…
-
AIDS Response US vs. Canada (The First 5 Years)

ElyaDatabase ID Number: M171 Creator: Josh Allon ’21 History The points illustrated represent various events that occurred in each country in approximately the first five years after each nation discovered their first cases of AIDS (not necessarily meaning they knew they were cases of AIDS at the time). The types of events represented by these points…
-
The Correlation Between State Pandemic Responses and States with Non-Discrimination Laws
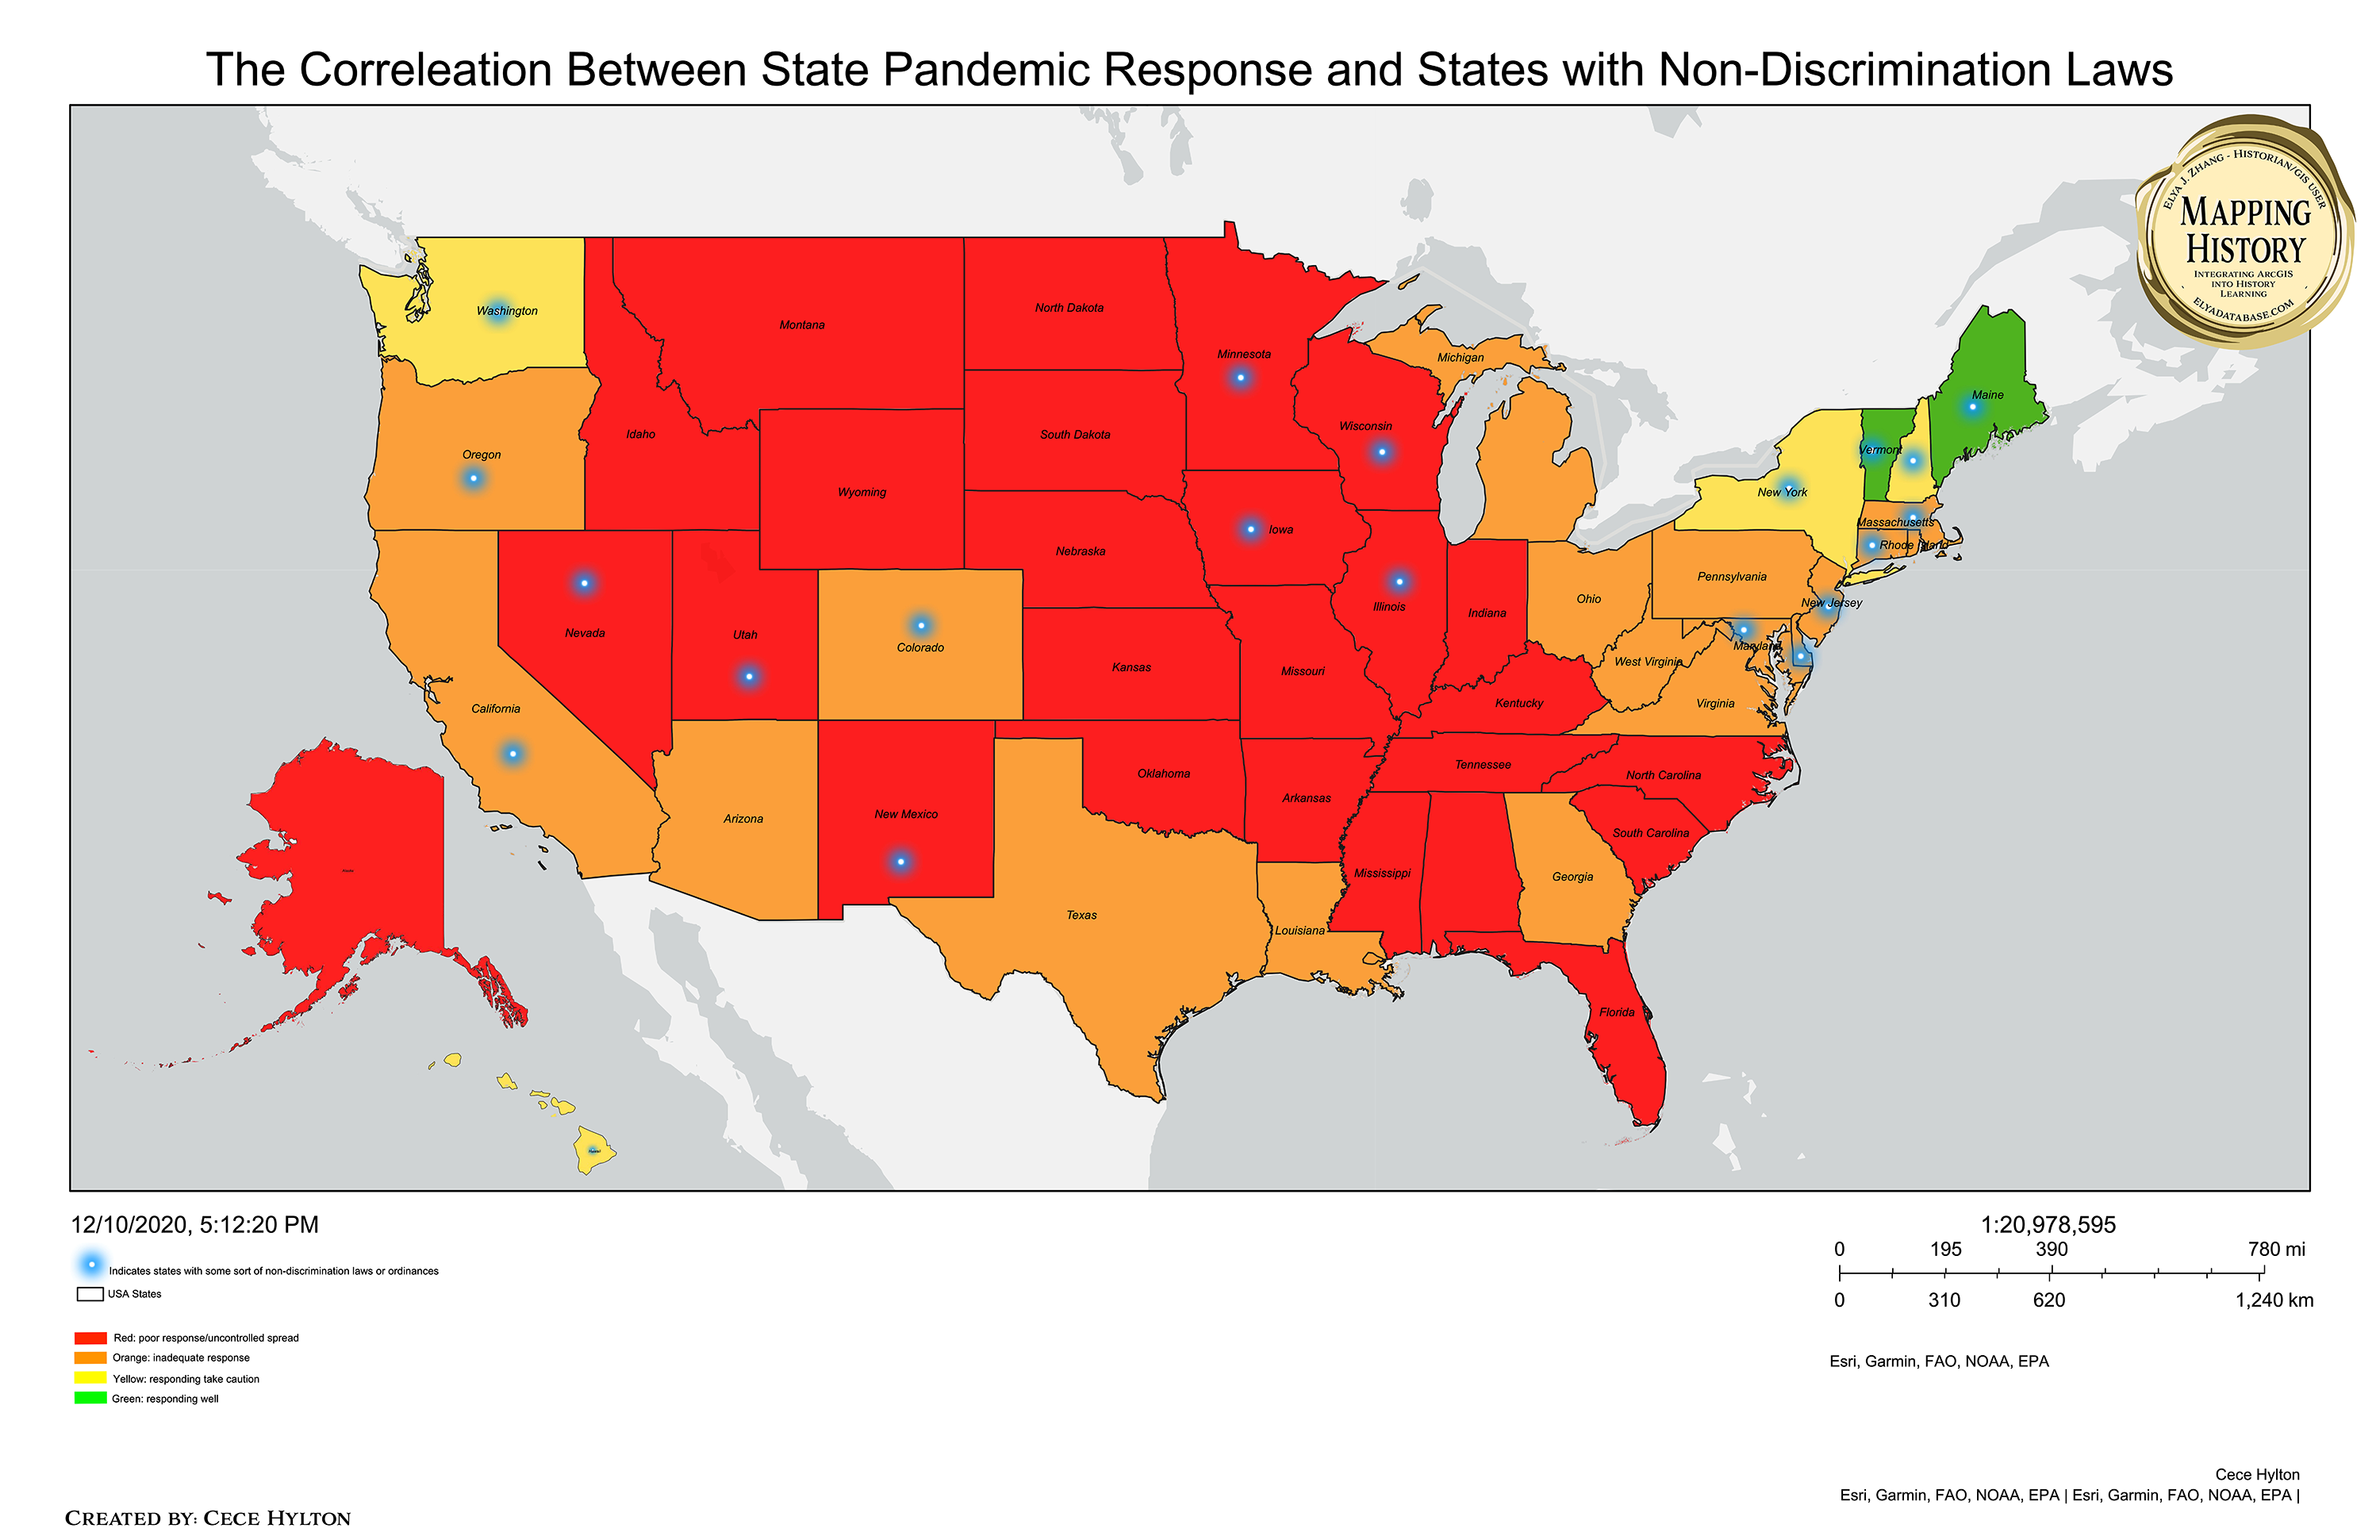
ElyaDatabase ID Number: M168 Creator: Cece Hylton ’22 Neuroscience This map draws a correlation between discrimination and pandemic response, specifically in the United States of America during Covid-19. Each state is shaded either red, orange, yellow, or green. Red indicates states that are responding very poorly, and there is uncontrolled spread. Orange indicates states with an…
-
Rise in Hate Crime Reports From 2019 to 2020

ElyaDatabase ID Number: M167 Creator: Ian Ono-Gerow ’21 East Asian Studies The Map shows the increase in the number of reported cases of hate crime in some of the major cities in the United States, comparing the year 2019 which was before the Covid-19 pandemic, and the year 2020, which is after the pandemic has started.…
-
California’s Deaths from the Pandemic
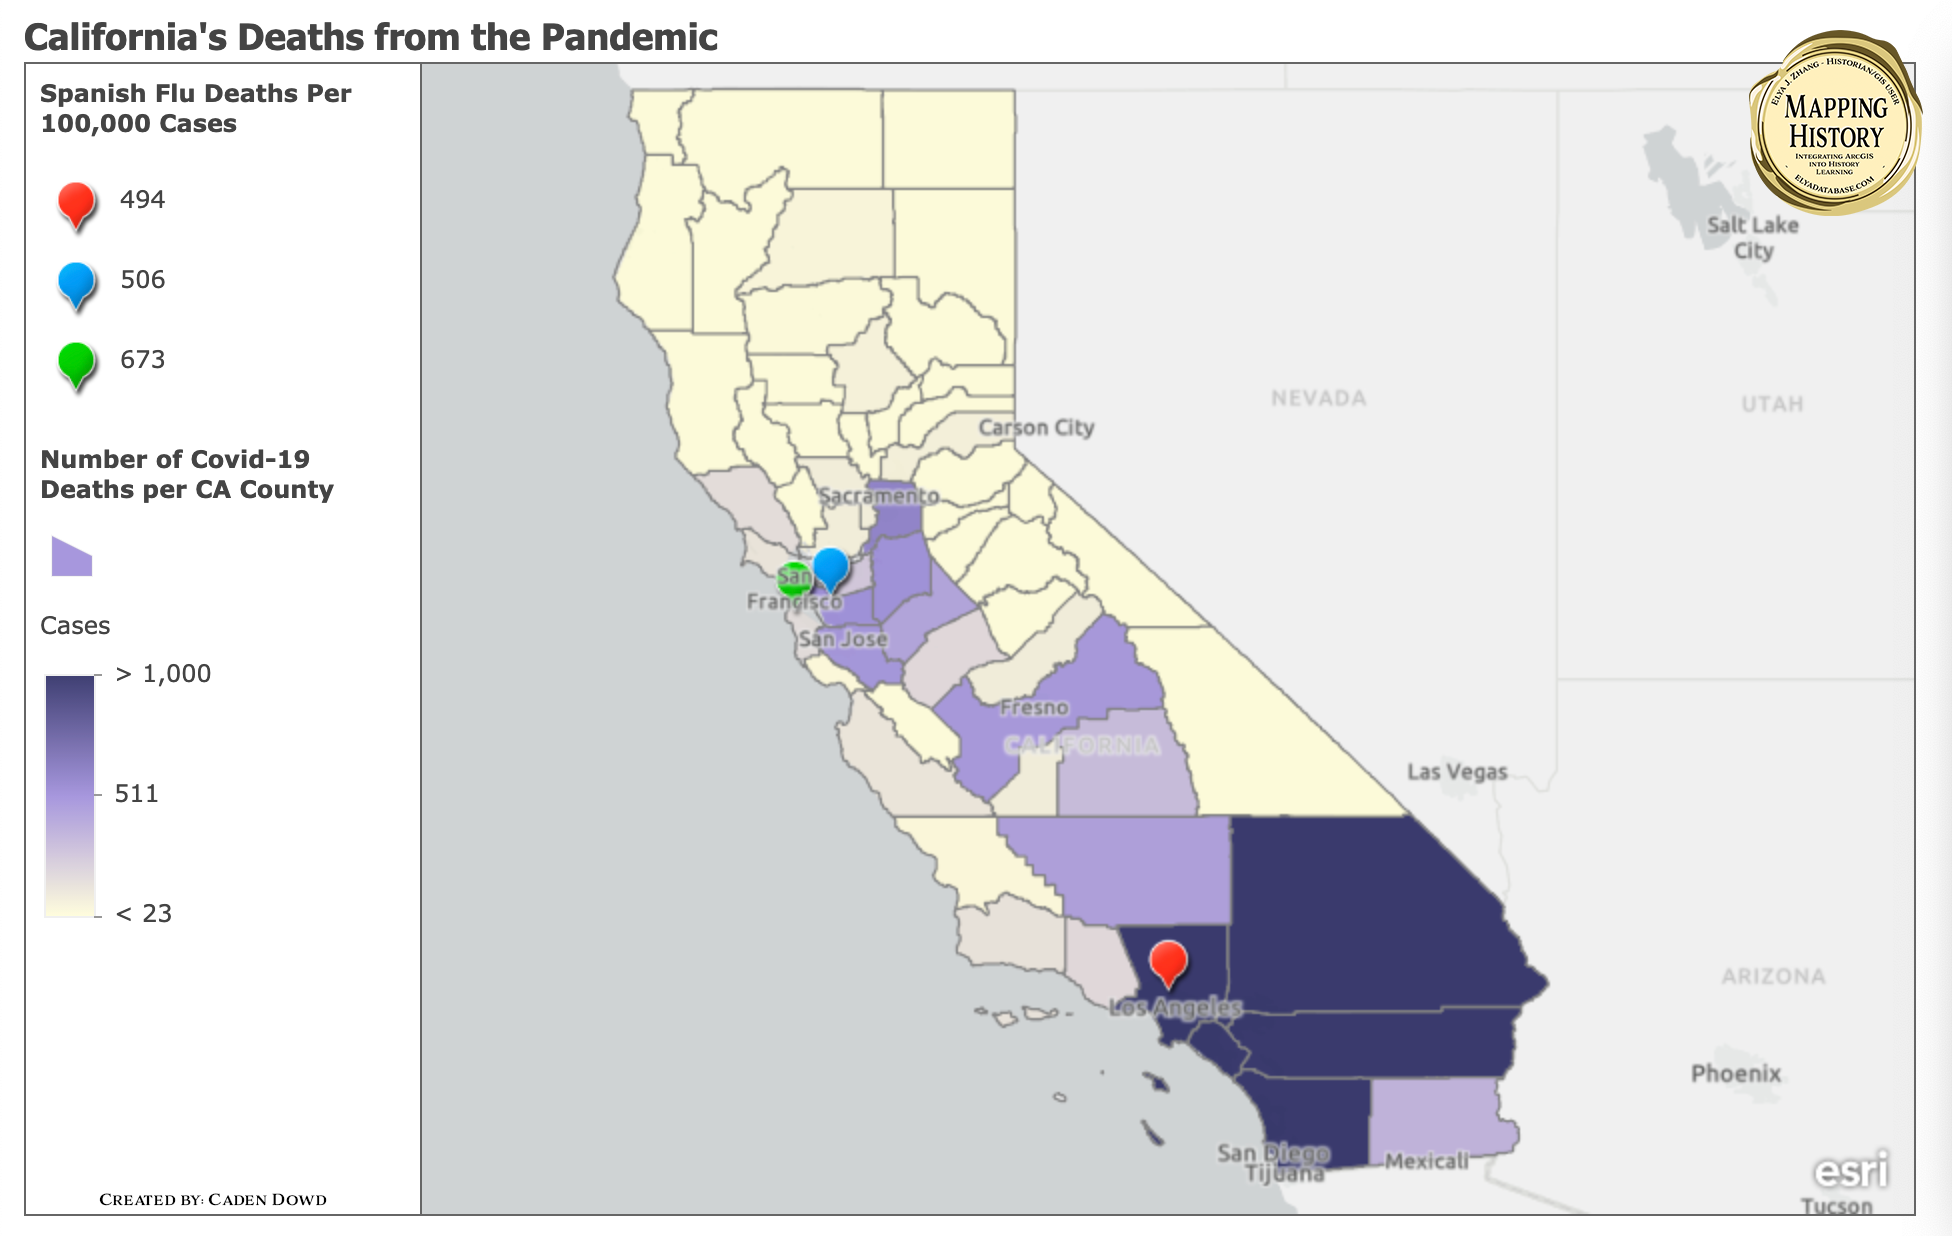
ElyaDatabase ID Number: M165 Creator: Caden Dowd ’22 Computer Science The map attempts to show both the Spanish flu and Covid-19’s effects in California during the pandemic. There was only data from the Spanish flu on death rates so that is what this map focuses on. There are individual points in the major cities that illustrate…
-
American Bases in Okinawa: Remove, Not Remove?
American Bases in Okinawa: Remove, Not Remove? On 19 June 2016, an estimated 65,000 people mourned the death of Rina Shimabukuro (1996-2016) at a stadium in Naha, Okinawa’s prefectural capital. Rina’s body was found in bushes beside a road in Central Okinawa, three weeks after she had disappeared while taking a walk. The only suspect…
-
Article Nine of the Japanese Constitution: Remove, Not Remove?
Article Nine of the Japanese Constitution: Remove, Not Remove? The current Japanese constitution was promulgated in 1947 as an amendment of the 1889 Meiji constitution. Its Article 9, the famous “peace clause,” states that “the Japanese people forever renounce war as a sovereign right of the nation and the threat or use of force as…