Tag: San Francisco, California (U.S.)*
-
AIDS Infection Rates vs. Gay owned Business Shutdowns, and COVID-19 Positive Cases vs. Asian American Owned Business Shutdown Hotspots

ElyaDatabase ID Number: M177 Creator: Kayla Ballas ’24 Public Health The first map displays the infection rates of AIDS per 100,000 people in juxtaposition to areas with high business closure rates. The lightest shade of red represents less than 10 cases per 100,000 people, the next shade of red represents 10-19.9 cases per 100,000 people, the…
-
An Analysis of the 1918 Spanish Flu, the 2020 COVID-19 Pandemic, and the Lasting Effects of Racial Disparities in the African Diaspora Exposed Through These Pandemics

ElyaDatabase ID Number: M172 Creator: Christina Inya ’21 Public Health This map demonstrates one of the commonalities between the 2020 COVID-19 pandemic and the 1918 Spanish Flu, in how the infection rates disproportionately targeted the Black communities living in America. It is especially interesting to note how during the 1918 Spanish flu, the top six most…
-
AIDS and COVID-19 Social Uprisings and Protests

ElyaDatabase ID Number: M169 Creator: Debie Aguilar ’22 Public Health This map details the AIDS and COVID-19 pandemic social uprisings that occurred throughout the United States. The blue squares show the cities that were affected by large number of COVID-19 cases and the purple squares depict the cities affected by AIDS cases. To further show the…
-
AIDS Response US vs. Canada (The First 5 Years)

ElyaDatabase ID Number: M171 Creator: Josh Allon ’21 History The points illustrated represent various events that occurred in each country in approximately the first five years after each nation discovered their first cases of AIDS (not necessarily meaning they knew they were cases of AIDS at the time). The types of events represented by these points…
-
Rise in Hate Crime Reports From 2019 to 2020

ElyaDatabase ID Number: M167 Creator: Ian Ono-Gerow ’21 East Asian Studies The Map shows the increase in the number of reported cases of hate crime in some of the major cities in the United States, comparing the year 2019 which was before the Covid-19 pandemic, and the year 2020, which is after the pandemic has started.…
-
California’s Deaths from the Pandemic
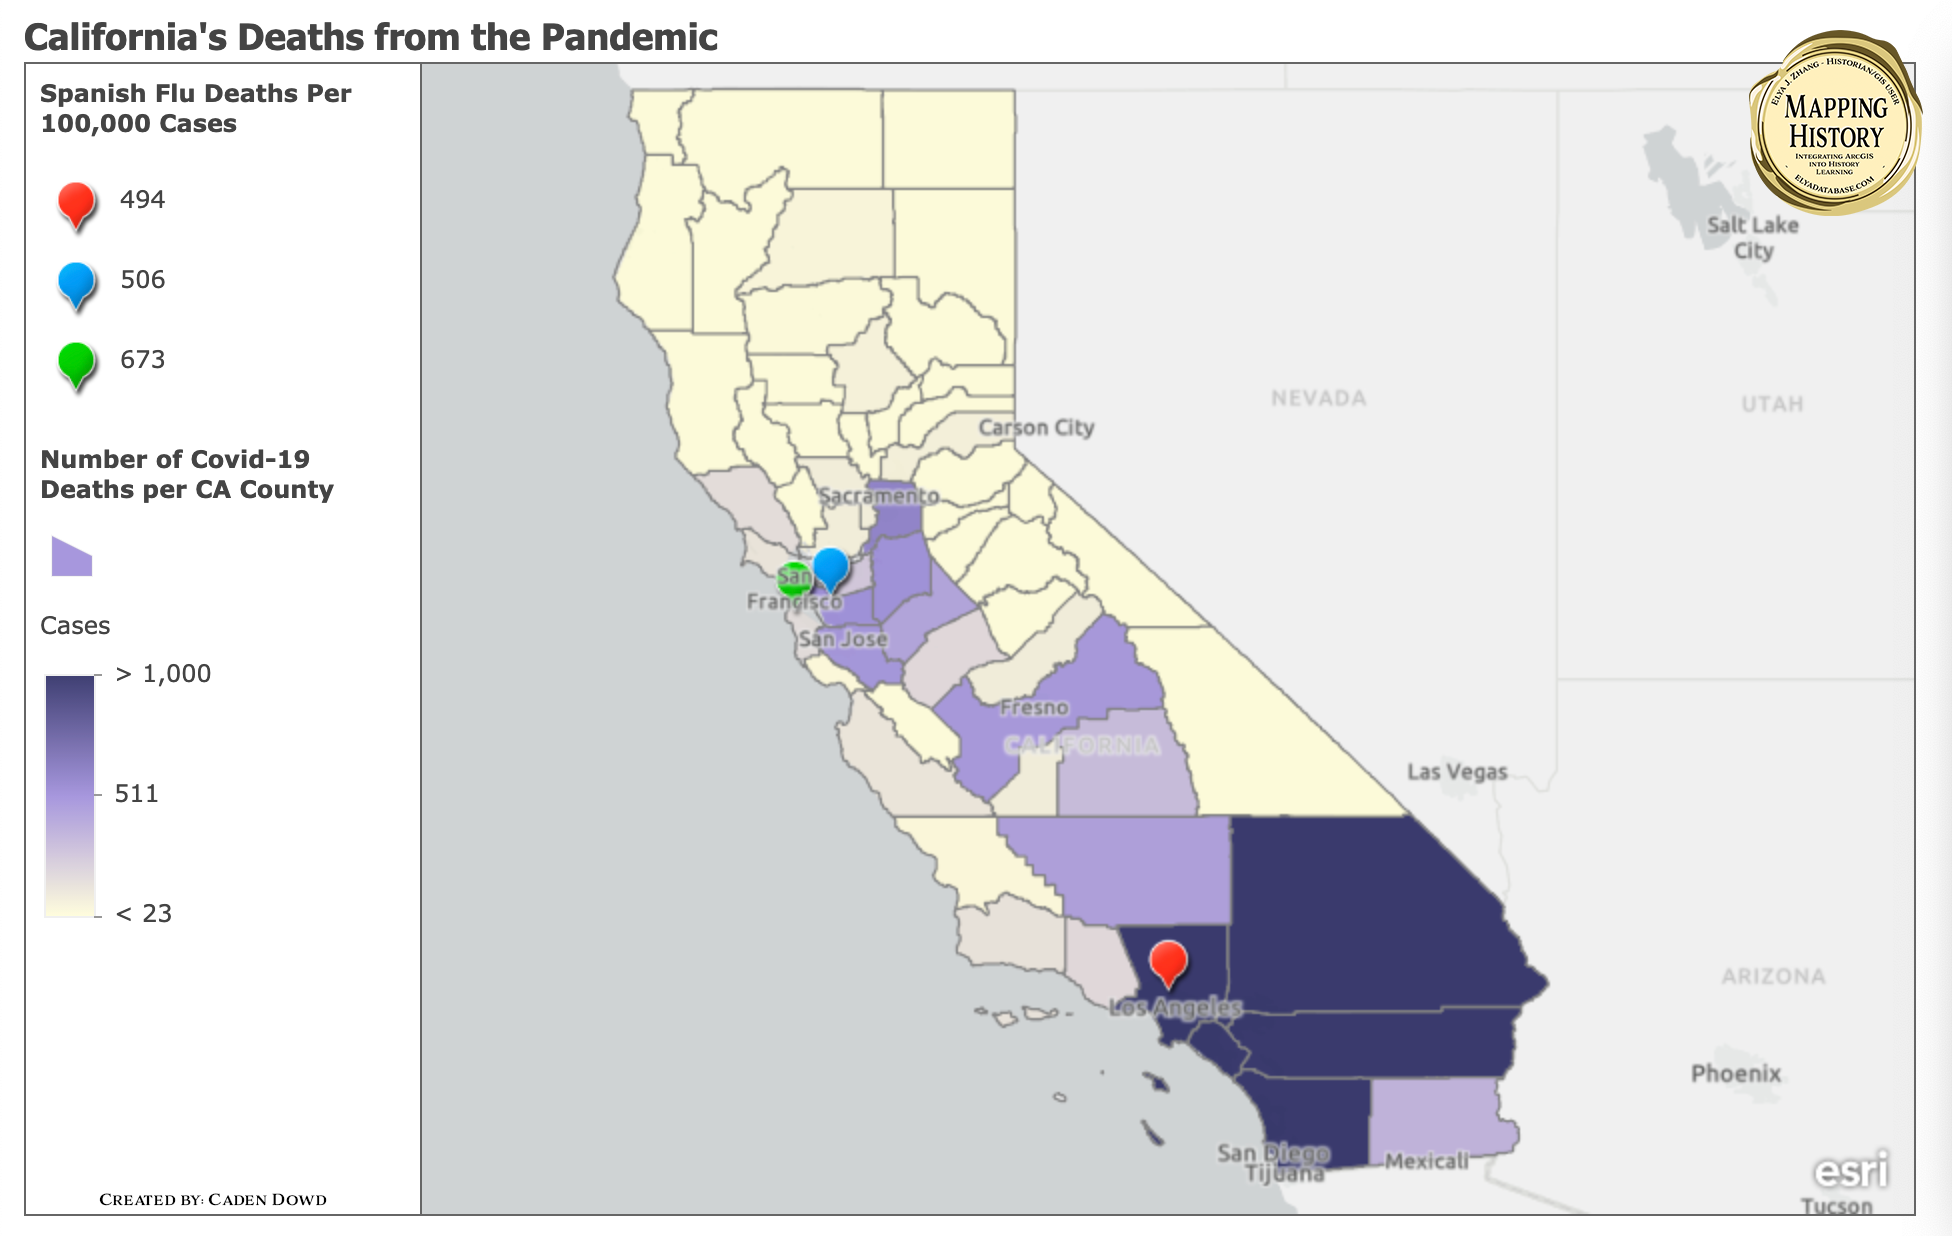
ElyaDatabase ID Number: M165 Creator: Caden Dowd ’22 Computer Science The map attempts to show both the Spanish flu and Covid-19’s effects in California during the pandemic. There was only data from the Spanish flu on death rates so that is what this map focuses on. There are individual points in the major cities that illustrate…
-
Covid cases, possible Spanish Flu and Covid transmission routes and mask mandates in the US
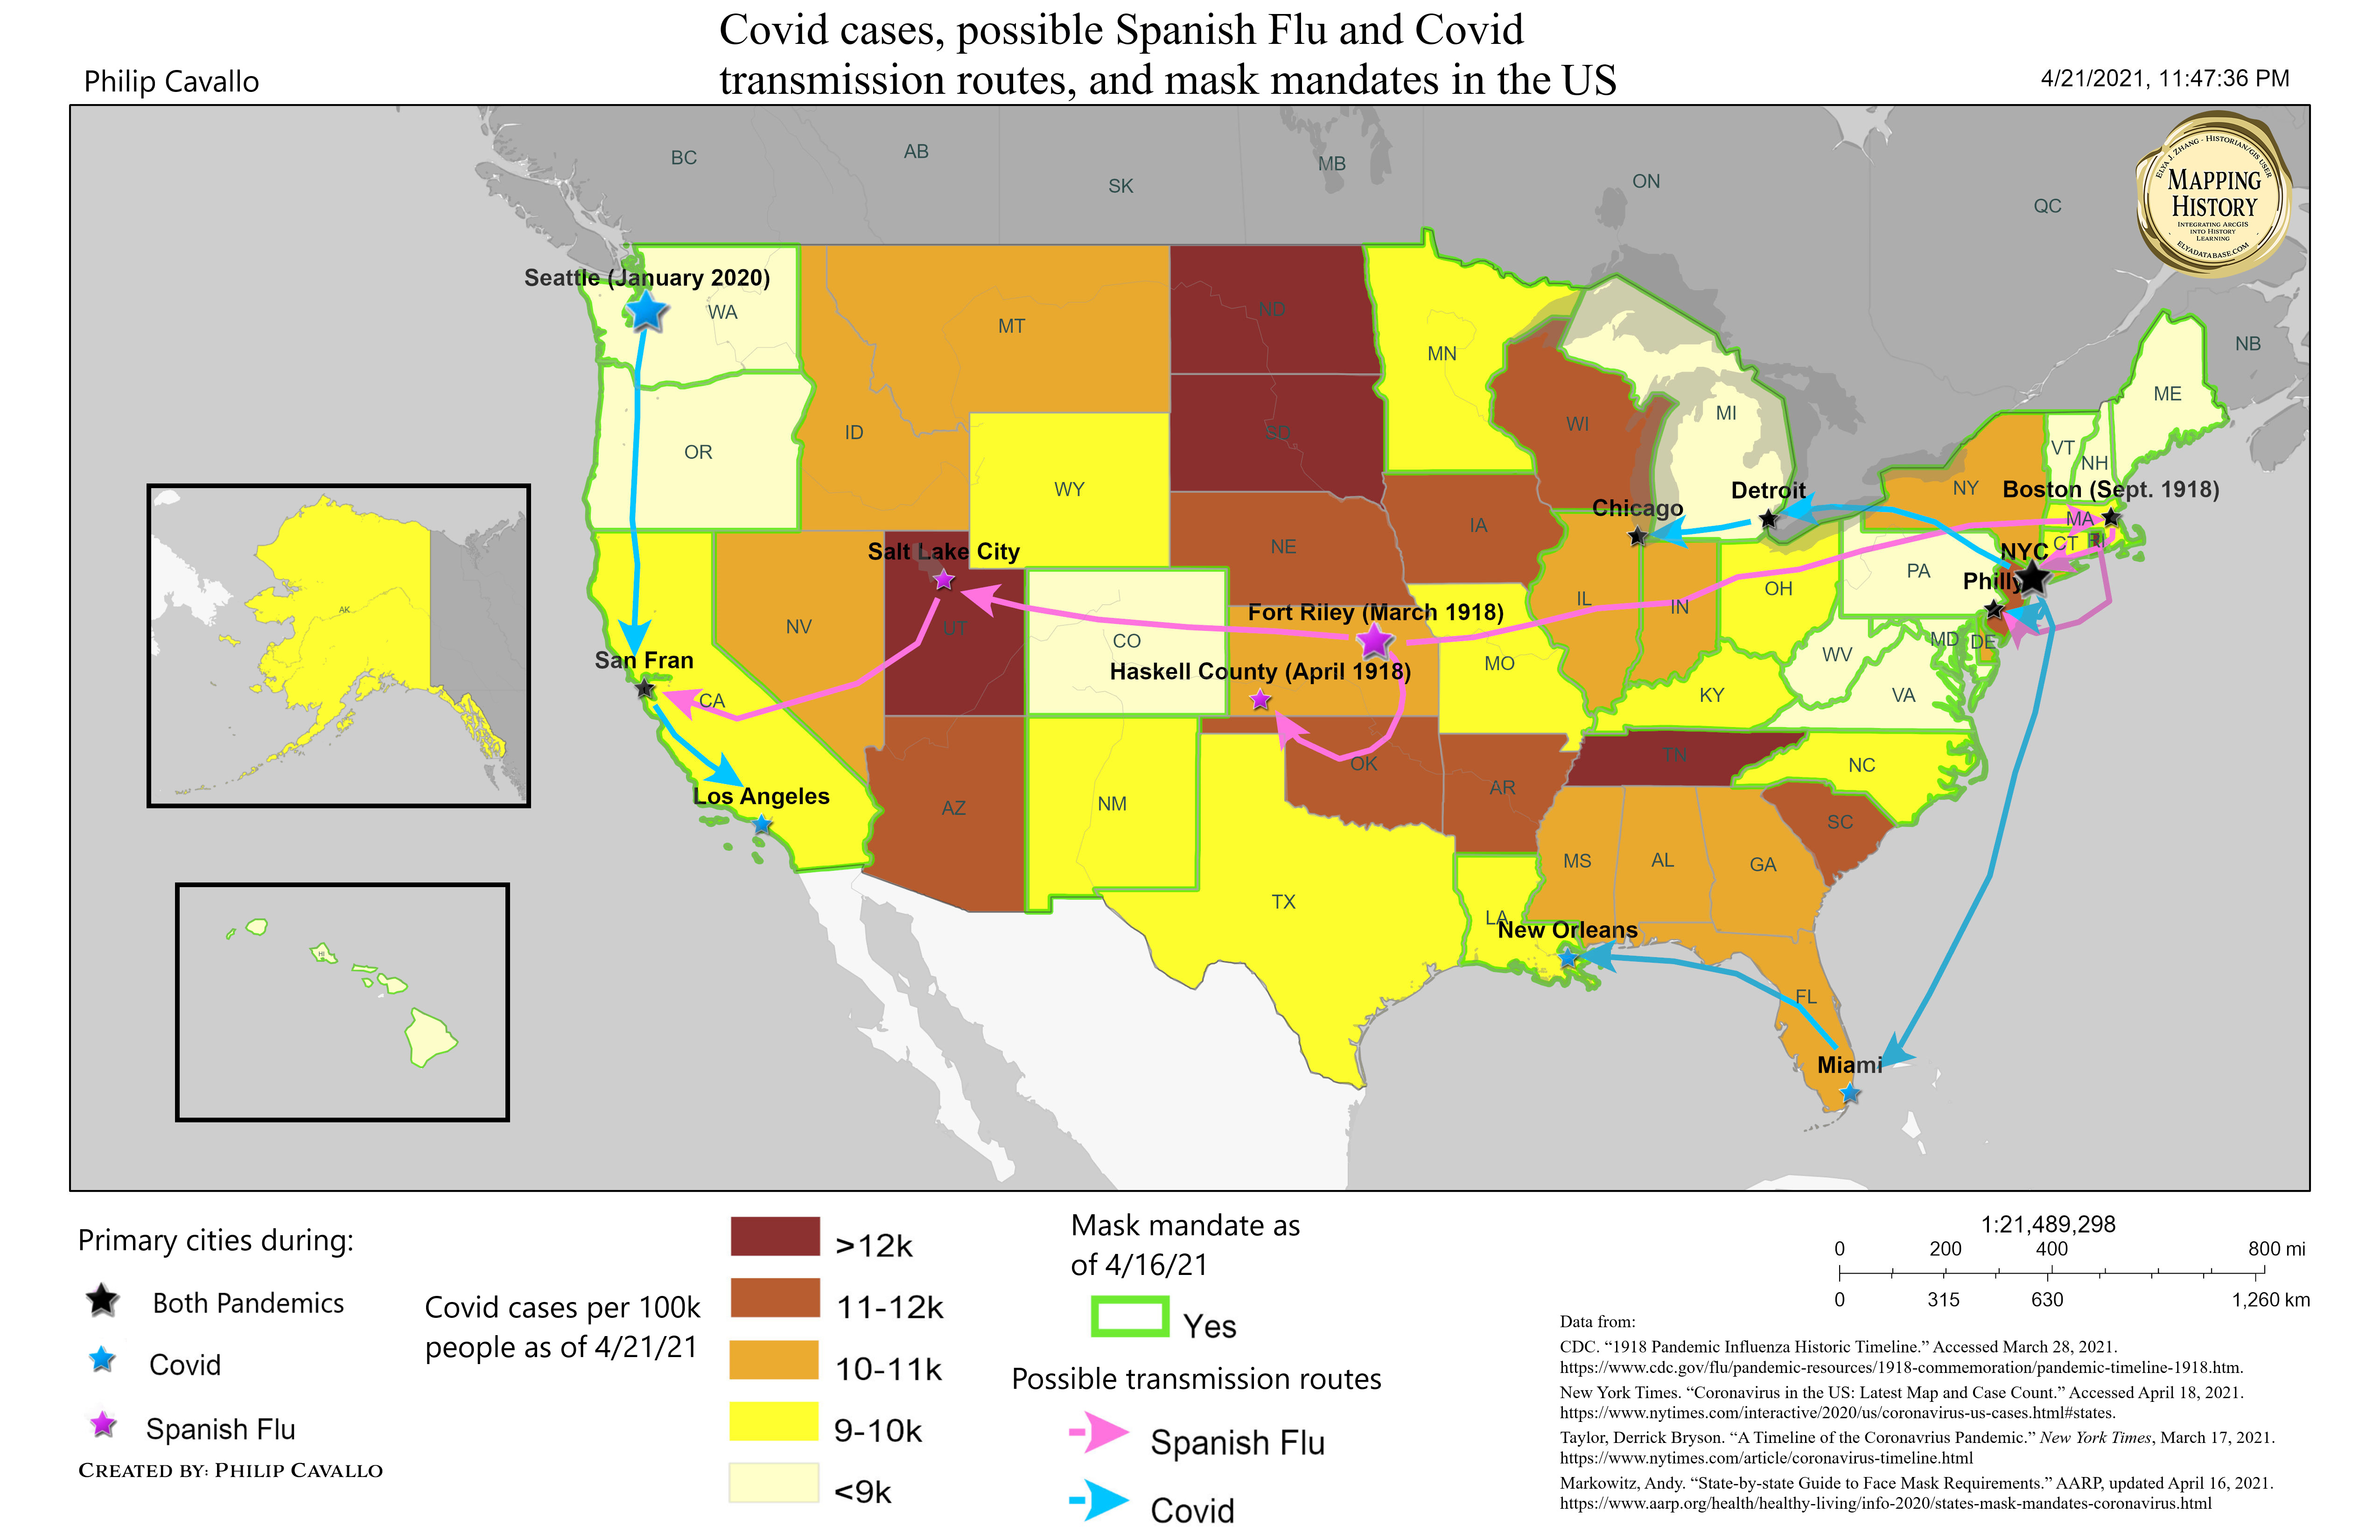
ElyaDatabase ID Number: M117 Creator: Philip Cavallo ’22 History Despite its name, the Spanish Flu most likely originated from the United States in Fort Riley Kansas. The government first took notice of the virus at Camp Devens, just outside of Boston. The Flu spread rapidly through the United States army in the first half of…
-
Mask Wearing Mandates: 1918 versus 2020

ElyaDatabase ID Number: M106 Creator: Maddy Davidson ’22 Health, Behavior & Society and Economics The 1918 flu was a deadly strain of the influenza strain that swept the country in the early 20th century. States and cities most commonly responded to this crisis by having laws against public spitting, and gatherings, and a few states…