ElyaDatabase ID Number: M115
Creator: Claire Paulson ’21 Microbiology
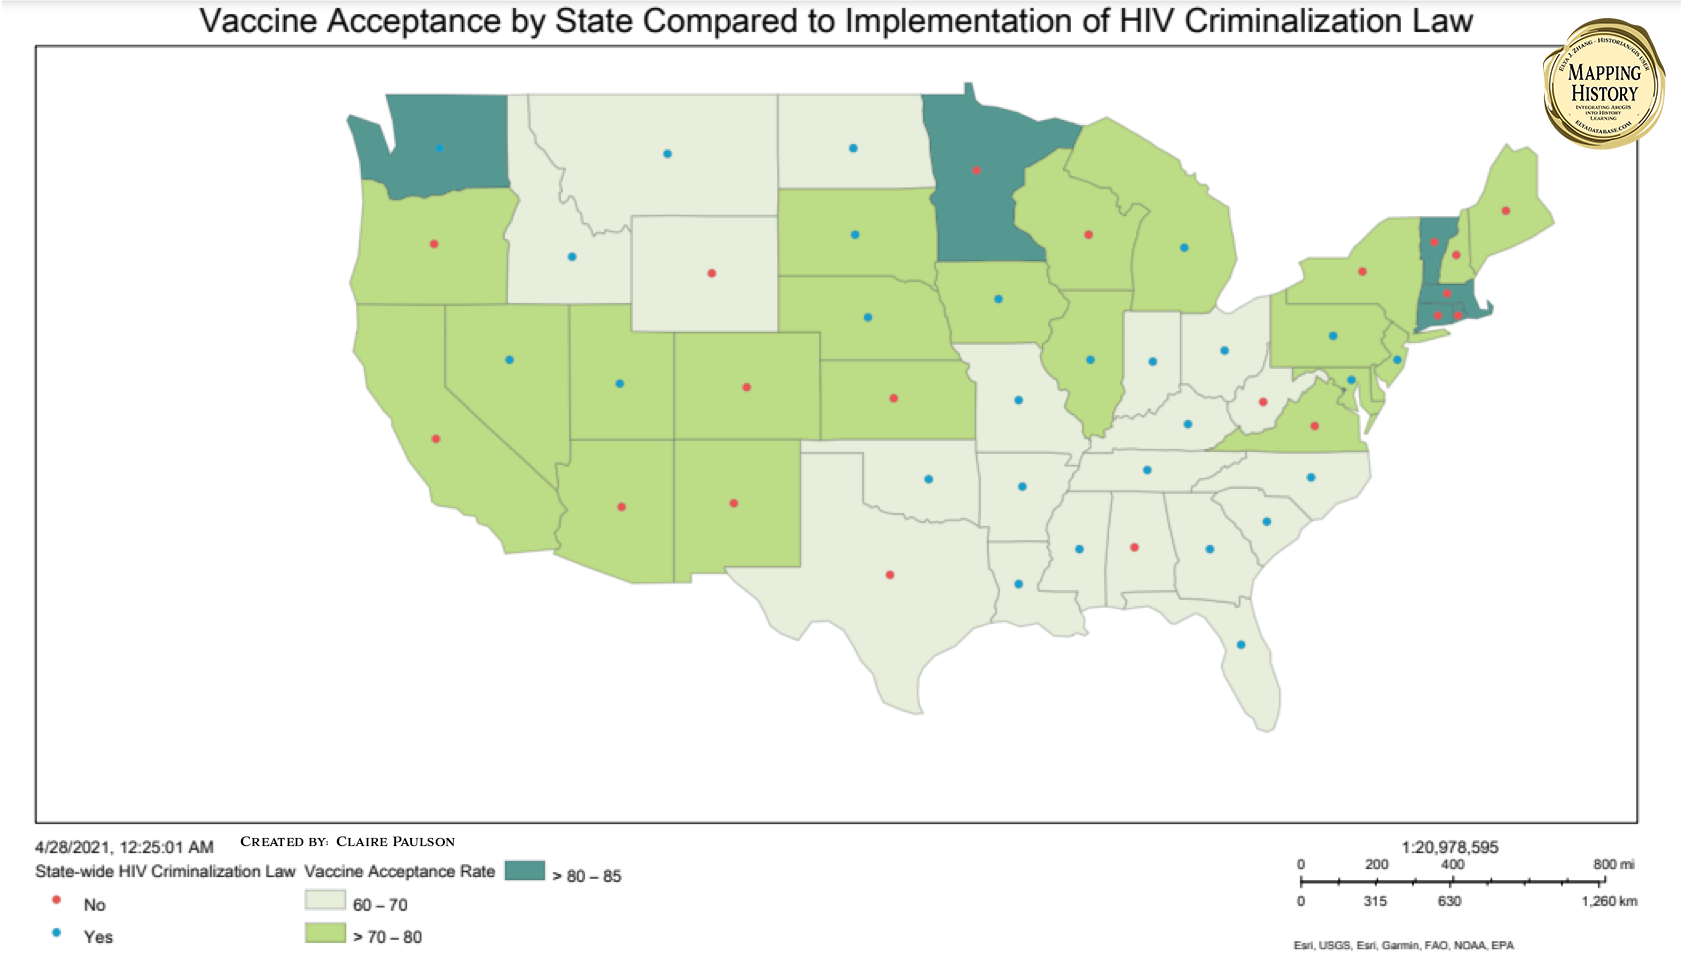
This map aims to represent the consequences of progressive and conservative moral values on a statewide level by comparing specific factors regarding the present-day COVID-19 pandemic and the HIV/AIDS epidemic of the 1980’s and 1990’s.Each state is shaded a color according to the percentage of its population that approves of the COVID-19 vaccine and accepts its efficacy as of January 1st, 2021. This data comes from a time where research and FDA approval has proven that the COVID-19 vaccines are an effective preventative medical measure, so therefore vaccine acceptance rate is a measure of the presence of views of personal freedom versus collective protection. A colored dot represents whether a state has mandated a statewide discrimination law that criminalizes HIV status and transmission, which is a lasting effect of the tumultuous HIV/AIDS epidemic in the United States. A region of interest is the clustering of states in the South that have a vaccine acceptance rate of 60-70% and have a mandated statewide HIV criminalization law, which falls in line with the generalized opinion that individuals living in the South on the whole have a more conservative and closed-minded moral code.
Cite This Work :
Claire Paulson, “Vaccine Acceptance by State on January 1st, 2021 Compared to Implementation of HIV Discrimination Law as of May 2021.” Scale: 1:70,000. In Elya J. Zhang, ed., Mapping History Series. <https://elyadatabase.com/2021/08/02/vaccine-acceptance-by-state-on-january-1st-2021-compared-to-implementation-of-hiv-discrimination-law-as-of-may-2021/> (accessed May 27, 2022).