

ElyaDatabase ID Number: M188
Creator: Elise Freling ’21 Film & Media Studies
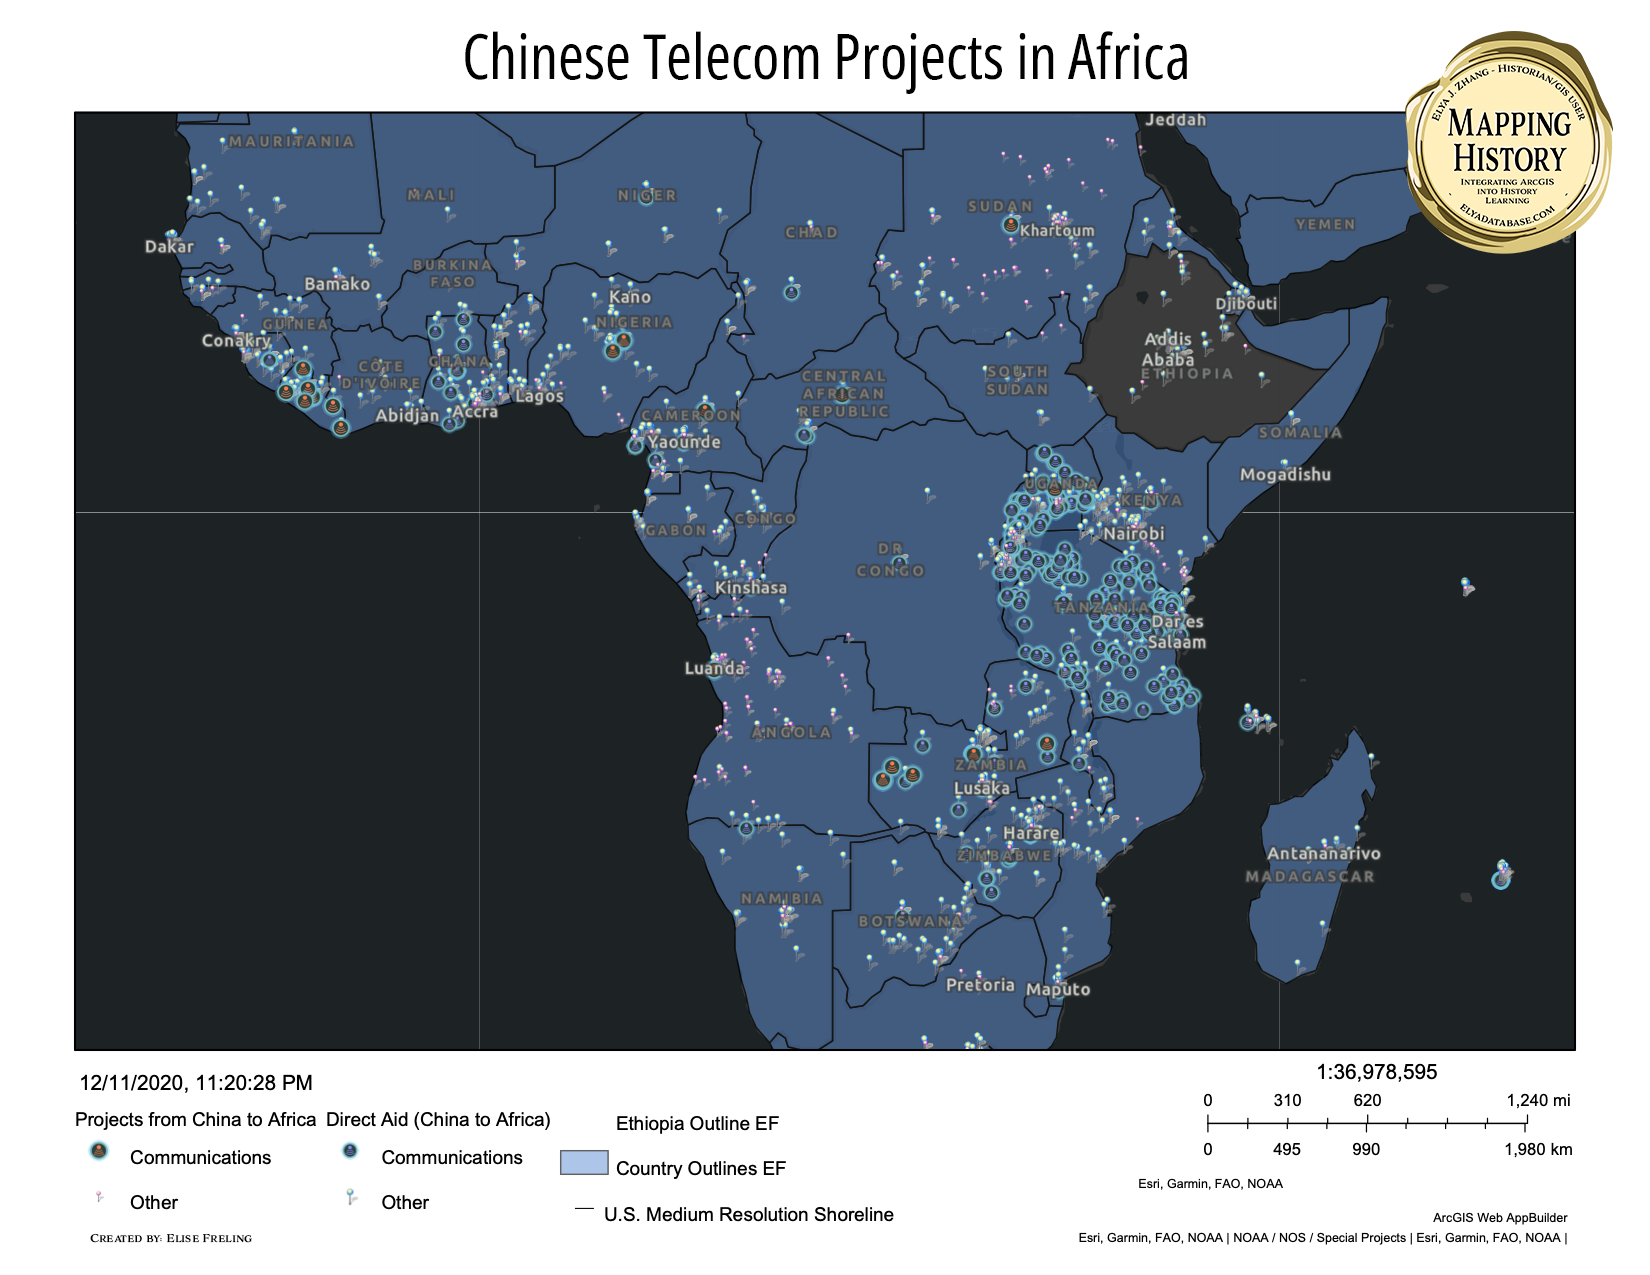
Continent (Africa) Map
I plotted out the distribution of direct aid and business deals between China and the whole of Africa in order to compare the frequency of overall projects in Ethiopia to the frequency of projects in neighboring countries. In Ethiopia, most of the builds (signified with light blue pins) are direct aid that range from loans for wind farms to railroads to food to agricultural centers. Examples of non-direct aid (pink pins) include more work on the wind farm, work on the Gibe III Dam, and building institutes. Significantly more aid and projects go to Kenya and Uganda. More projects go to Sudan. Much more aid goes to Tanzania, with most of the aid coming in the form of Communications (blue wifi signals). The relatively small number of Chinese-funded communications projects in Ethiopia itself are indicated by the total absence of aid or non-aid projects included in this extensive dataset, which includes projects up to 2014.
Ethiopia Map & Addis Ababa Map
This map intends to examine the location of cell phone towers in Ethiopia, in context of different regions.
The brightly colored orange, blue, and green dots in this map plot out the spread of cell phone towers across Ethiopia, including GSM (2G) (orange dots), UMTS (3G) (bright blue dots), and LTE (lime green dots – made larger for visibility, since there are there are only 161 in comparison to the almost 1500 GSM and UMTS towers). Phone towers follow roads and tend to cluster around major cities such as Gondar, Bahir Dar, Dire Dawa, with by far and away the most located near or in Addis Ababa.
The density of towers does not seem to correlate strongly with economic status of the region. I indicated the poverty head count per administrative region, the percentage of the population under the national poverty line (diamonds and shading/dotted border of the region). The pale blue regions have the highest rate of poverty and the dark purple regions the lowest. If anything, cell phone towers seem more densely placed along the roads in moderate and poorer areas. I had expected the 3G and LTE towers to be in wealthier areas and the 2G towers to be in poorer areas, but after plotting out the data with the regional borders, that wasn’t true at all. The proportion of GSM and UMTS seem relatively equal wherever there are towers, indicating a pretty equitable distribution in terms of wealth; however, large regions, especially Somali and other areas near the edge of the country, have very little access.
Most of the cell towers are in Addis Ababa, which is moderate on the economic scale. However, it is the location of the AU and a wide array of government buildings. The capital city is plugged into the international community, and not only is the most infrastructure found there, but also the fastest. The LTE towers, sometimes called 3.95G (green, larger dots) are only found in this city. Both the Huawei and ZTE headquarters are located in the capital city, presumably where both companies are most active. You can also see a road (white dotted line) and the towers following it.
Cite This Work :
Elise Freling, “China-Built Telecom Infrastructure in Ethiopia.” Scale: 1:70,000. In Elya J. Zhang, ed., Mapping History Series. <https://elyadatabase.com/2022/06/12/china-built-telecom-infrastructure-in-ethiopia/> (accessed May 27, 2022).
Leave a Reply